
Understanding the Investors’ Investment Decisions through Some Data Mining Tools- A Study in Dhaka Stock Exchange (DSE)
Md. Khashrul Alam
Business Administration Discipline, Khulna University, Khulna, BD
S. M. Towhidur Rahman
Business Administration Discipline, Khulna University, Khulna, BD
Afifa Khanom
Business Administration Discipline, Khulna University, Khulna, BD
Khulna University Business Review – A Journal of Business Administration Discipline, Khulna University, BD
Volume 11, Number 1 & 2, January to December 2016, Pages 9-19
DOI: 10.35649/KUBR.2016.11.12.2
Published: May 2018
Published Online: July 2019
Abstract
Purpose: Decision making is the process of choosing a particular alternative from a number of alternatives. Decision making is very much important in investment in the stock market. As it is enormously sensitive, a wrong decision may put the investor back to the street. Modern scientific data mining tools can play important role in making investment decision in the stock market. The purpose of the study is to find out the effectiveness of investors’ decision in buying and selling stock and the efficiency of some data mining tools in aiding investor’s decision.
Methodology: This paper used several data mining techniques such as beta, Chaikin money flow indicator (CMI) and Bollinger band to analyze investors’ decision in buying and selling stocks. Data for the study were taken both from primary and secondary sources specially, from website of Dhaka Stock Exchange.
Findings: The result shows that in most cases majority of investors failed to take right decision in right time in terms of the estimation derived from data mining tools used in the study. It was also found that Bollinger band was found to be more efficient than CMI in making prediction.
INTRODUCTION
Stock market is an essential part of a country’s economy. Investors of the stock market invest their surplus money in the stock market mainly for achieving economic prosperity and for many other factors. The motivation of such investment is always beneficial for the country as it ensures healthy money flow between lenders and borrowers. The fundamental function of stock market is to arrange a secure, dependable and an efficient way of transferring funds between borrowers and lenders. To serve the basic function of stock market in Bangladesh, Dhaka stock Exchange (DSE) was established in the capital city. DSE becomes the best performing stock market of Asia in 2008 notwithstanding the global financial crisis (Asia Monitor, 2008). As a matter of fact, gains in DSE attracted investors of all level to invest in the stock market. However, the tempo could not be sustained and the market crashed in 2011. The index crossed 8500 points in 2010 and dramatically collapsed in the first quarter of 2011 and reached to 5500 points in October 2011. The continuous down movement of stock prices created panic among the investors in the market specially the individual investors.
Financial market is in fact a complex, non-stationary, noisy, chaotic, nonlinear and dynamic system but it does not follow random walk process. The predictions of stock market price and its direction are quite challenging because a number of factors cause fluctuation in financial market movement including economic condition, political situation, traders’ expectations, catastrophes and other unexpected events (Ou and Wang, 2009). Within this inherent uncertainty in the stock market, investors usually invest based on their traditional knowledge. Sometimes they become gainer but sometimes this knowledge can’t help them turn just into a street beggar. In coping with such difficulty, data mining (or machine learning) techniques have been introduced and applied for this financial prediction which expects to aid investors to make better investment decisions and to prevent the extreme negative situation (ibid). So, in this study some data mining tools are employed and it is assessed whether they are more efficient than traditional decision making knowledge or not.
LITERATURE REVIEW
Data mining is a buzz word in today’s knowledge driven economy. Data mining, also called data or knowledge discovery, is the process of analyzing data from different perspectives and summarizing it into useful information. Technically, the data mining involves in finding correlations or patterns among a number of fields in large relational databases. Simply data mining is used for mining data from databases and finding out meaningful patterns from the database (Mahajan and Kulkarni, 2013). It is also described as “Making better use of data”. Every person is increasingly facing unmanageable amounts of data in all spheres of life and hence, data mining apparently affects all of us (Kannan et. al., 2010). In business data mining has gained increasing acceptance for its ability to analyze large amounts of data to discover knowledge. Specially, stock markets generate and make it publicly available huge amount of financial data making it extremely complex and difficult for investors to take decision. Thus, financial markets create opportunity for application of different data mining tools to solve these complex and dynamic problems. The research in data mining has gained a high attraction due to the importance of its applications and the increasing information (Mahajan and Kulkarni, 2013).The use of data mining tools are expected to benefit investors in making better prediction of stock market trends and determine the buying and selling points of equities. Different tools are used to analyze stock market data to predict prices. Typical Price (TP), Chaikin Money Flow indicator (CMI), Stochastic Momentum Index (SMI), Relative Strength Index (RSI), Bollienger Bands (BB), Moving Average (MA) and Bollienger Signal are few of those and a combined application of these tools might provide better prediction of stock prices (Kannan et. al., 2010). Beta is one of the tools that are used for analyzing market returns. The concept of beta was introduced by Markowitz (1959) and is being widely used to measure the systematic risk involved in an investment. The beta (β) of an investment measures the volatility of an individual stock compared to the market as a whole that may arise from general movement of market when the market is not in ideal situation (Wikepedia, 2012). Particularly the beta helps an investor to anticipate how much a particular stock may increase or decrease in price compared to the movement of the market as a whole. A high beta value of a stock does not indicate that the stock price will increase in the future; it indicates that the stock is much more volatile than the market as a whole. Thus if the market rises, a stock with a high beta will increase. Similarly, if the market falls a stock with high beta should fall. On the other hand, a stock will maintain a much steadier pace if the beta value of the particular stock is small (Wahlstrom and Froelich, 2008). Although the beta can predict the volatility of stock, it has no upper limit or lower limit and is not fully appropriate to measure stock return (Khalid et al., 2013). Thus other analytical tools should be incorporate with beta for getting a full analysis about a particular stock.
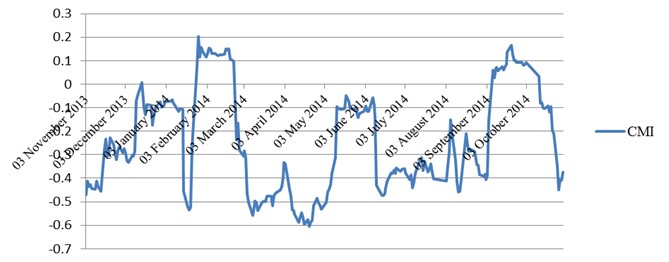
Volume can be a useful indicator to predict the movement of the stock for investors and technical analysts. (Blume et.al., 1994) stated that volume and price change have positive relationship which helps technical analysts in decision making. Different volume indicators are found to be used by technical analysts such as on-balance volume (OBV), money flow index, Accumulation/ Distribution Line and Chaikin Money Flow. Accumulation/ distribution (AD) indicators considers the high, low and closing price of the shares and volume of the corresponding days to study the pattern. As the extended version of the accumulation/ distribution indicator, Chaikin Money Flow considers the accumulation/ distribution values for 21 days period. The assumption under the Chaikin Money Flow is that a bullish stock will have a relatively high close price within its daily range and have increasing volume. This condition would indicate a strong security. However, if it consistently closed with a relatively low close price within its daily range and high volume, this would indicate of a weak security. Marc Chaikin considers a reading below -0.25 to be indicative of strong selling pressure and conversely, a reading above +0.25 is considered to be indicative of strong buying pressure (Kannan et. al., 2010).
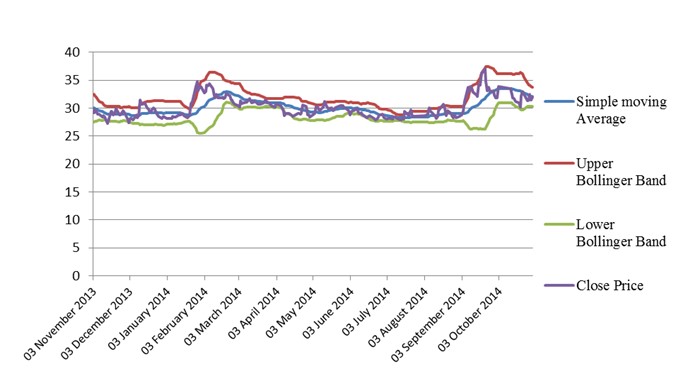
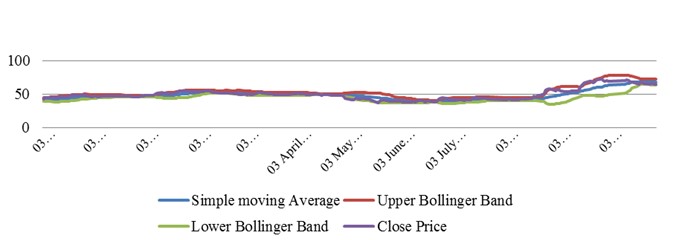
Similarly, Money flow index (MFI) also considers the high, low and close price of the shares and volume of the corresponding period to determine the index. This index assists investors to infer the degree of the demand of the stock (Granville, 1976). Volume is studied in isolation as confidence proxy; as a liquidity parameter; depth assessment indicator, whereas, volume when studied along with other parameters such as price or returns, reveals interesting conclusions like price direction, momentum, etc. (Mehra et. al, 2014) Bollinger band is a stock analysis tool invented by John Bollinger in the early 1980 (http://www.bollingerbands.com). Bollinger bands method is widely used, however, not so thoroughly studied in a scientific way (Ryazanova Oleksiv, 2008). (Hurst, 1970) was first to apply trading bands in investment analysis. The author suggested to graph continuous curves over and down from original stock price. Trading band technique became even more attractive when Bollinger suggested concentrating on volatility. Standard deviation was selected as the best measure for volatility because of its sensitivity to extreme deviations (Bollinger, 1992, 2001). (Mandelbrot,1963) has showed that the daily stock price returns are not normally distributed and the effective market hypothesis is not adequate. Bollinger band technique is used not only by stock trader. For example, it is rational to sell options when Bollinger bands are far apart for some period of time and buy options when Bollinger bands are close together for some period of time. In both situations, it is expected price volatility to get back to its average value during a long term period (Lento & Gradojevic, 2007). According to (Kamath, 2012) and (Kannan et. al., 2010) in a bullish market when the price of a stock increases and reach to the upper band the price will fall as the stock overbought. Alternatively, when the price of a stock decreases and reach to the lower band for overselling the price of the particular stock will rise. Bollinger Bands are drawn based upon a simple moving average. This is because a simple moving average is used in the standard deviation calculation. The upper band is two standard deviations above a moving average; the lower band is two standard deviations below that moving average; and the middle band is the moving average itself. This indicator is plotted as a grouping of 3 lines. The upper and lower lines are plotted according to market volatility where the gap between the lines reflects volatility – the wider the space between the lines, the more volatile the market is and vice versa. The middle line is the simple moving average between the two outer lines (bands). As prices move closer to the lower band, it indicates that the stock is oversold and the price should soon rise. Conversely, prices closer to the higher band are an indication that the stock becomes more overbought and prices should fall. It should be noted that Bollinger Bands (BB) do not prescribe explicitly to buy or sell rather generally provide a form of guideline, indicating possible trend reversals. In this case, if the current price breaks through the lower Bollinger band it is considered a buy signal, while if it breaks through the upper band it is considered a sell signal. (Kannan et al., 2010).
OBJECTIVES OF THE STUDY
In this study the main objective is to evaluate the Data Mining Tools over the traditional knowledge based investment decisions. The specific objectives of the study are-
- To assess investors decision through different data mining tools
- To suggest a suitable data mining tools
METHODOLOGY
Both primary and secondary data were used to conduct the study. For collecting primary data, 100 individual investors having portfolio in Dhaka Stock Exchange (DSE) were randomly selected. For getting secondary data, 04 companies from 04 distinct areas were randomly selected. Respective data of those companies were collected from DSE website. Following companies have been selected for the study.
| Field | Company |
| Bank | National Bank Ltd. |
| Textile | Saiham Textile |
| Ceramic | RAK Ceramic |
| Pharmaceuticals and Chemical | BeximcoPharma |
Purchase and Sell date of selected stocks of 100 individual investors were taken from primary data collection. Then with the information of secondary data from 01 November, 2013 to 30 October, 2014, two distinct data mining tools namely Chaikin Money flow Indicator and Bollinger Bands were used. By using these tools it was found out whether the decision of the time for buying or selling by the investors was accurate or not. To get more precise result, β analysis was incorporated with these tools. The application procedures for these tools are explained below:
(i) Beta Analysis: Beta (β) is a measure of the relationship between an individual stock’s return and the performance of the market. Shares with lower beta are safer choices and more suited for risk adverse investors. The inter operations of beta is as follows:
| β <0 |
There is an inverse relationship between the stock movement and market performance. The value of the stock is expected to decrease with the increase in the market. While this relationship theoretically exists, few stocks possess a negative beta. One example of an investment with negative beta is gold. |
| β =0 |
The stock’s returns are neutral to market moves. |
| 0< β <1 |
Slower movement in stock than the market is expected. If the market rises, this stock should also rise but at a slower rate; likewise if the market falls, this stock is expected to be less volatile than the market. |
| β =1 |
The stock should move in a similar fashion compared to the market as a whole. |
| β >1 |
The stock has proven over time to be more volatile than the market. As the market rises, this stock should rise at a higher rate. Likewise, a more severe loss is anticipated in the event the market falls. |
Formula for beta (β) analysis:

Covariance (Ra, Rp) = Covariance between stocks return and market return.
Var (Rp) = Variance of market return
(ii) Chaikin Money Flow Indicator: The calculation for Chaikin Money Flow (CMF) has three distinct steps (here we used a 21 Period CMF):
-
- Find Money Flow Multiplier

- Calculate Money Flow Volume

- Calculate the CMF

- Find Money Flow Multiplier
(iii) Bollinger Bands: The Bollinger Bands are calculated as:


RESULTS & DISCUSSIONS
In this section, the data collected from secondary sources and from the respondents are analyzed and presented in order to determine the effectiveness of the data mining tools and the effectiveness of the investors’ decisions.
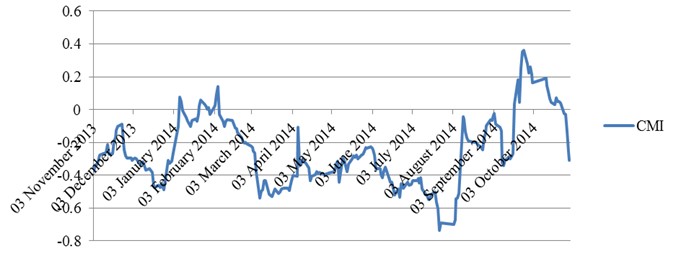
National Bank Ltd. (NBL): The Beta of NBL is1.42332. This Beta shows this stock is high volatile and also high risky since the beta value is more than 1.
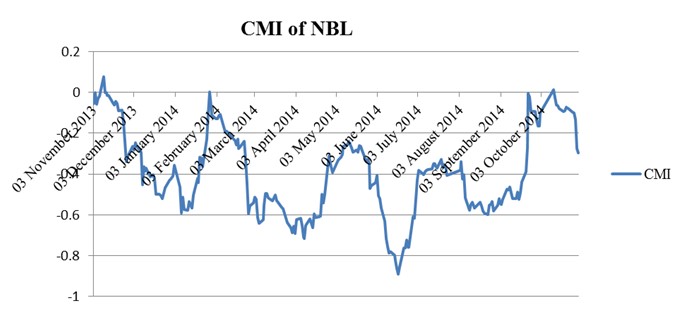
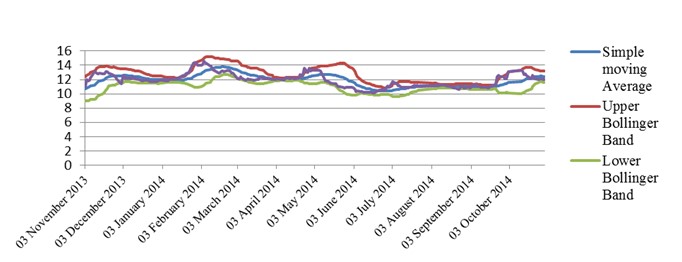
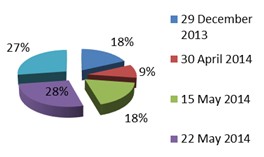
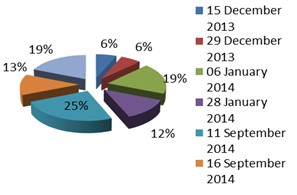
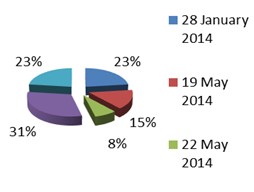
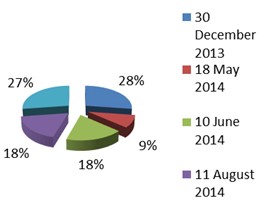
Purchase and Sale by Respondents: In May 22, 2014 we See CMI continuously remained below – 0.25 for a long time. That means it was a weak security and in Bollinger Band Closing price remained near to the lower band for some days meaning that it was purchase time. In May 22, 2014, 28% investor are found to take right decision to purchase but 9% investor was found wrong to purchase in April 30, 2014 because that time both CMI and Bollinger Bands resembles selling time. In September 11, 2014, CMI showed selling signal but Bollinger Bands showed that was the purchase time. 25% investors sold their stock that time and after that as the price increased they faced loss.
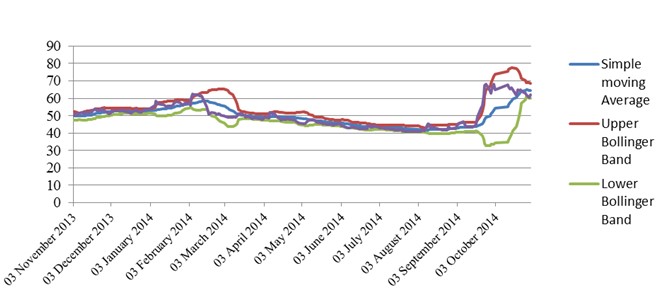
Saiham Textile: Beta less than 1 specifies less volatility. Saiham Textile has Beta of 0.788985. It indicates that Saiham Textile is less volatile and less risky stock.
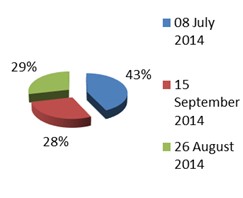
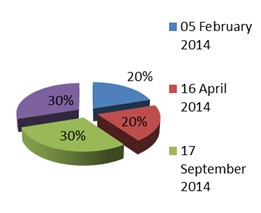
Purchase and Sale by Respondents: In September 17, 2014 CMI was in upper half but not above + 0.25. This is not strong buying signal. In Bollinger Band closing price remained near to the upper band for a long time then and few days after that day price started to fall. 31% of respondents are found to invest that time. So they faced loss. In July 8, 2014 CMI gave selling signal. In Bollinger Band it was found that before July 8, 2014 closing price ran closer to the lower band. This resembled that the price would rise soon and ultimately that happened. In our survey we see that 43% investor’s sale that time.
RAK Ceramic: The Beta of RAK Ceramic is 1.11124. It indicates that the stock of RAK Ceramic is high volatile.
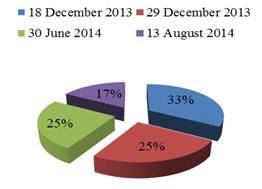
Purchase and Sale by Respondents: In January 12, 2014 CMI showed selling signal and in Bollinger Band, closing price remained in the middle of upper and middle band. It indicates that price might fall in future. Here we found that although price remained stable for some days it ultimately faced a huge drop in the middle of February. In January 12, 2014, 40% investors made investment and they had to face loss afterwards. In December 18, 2013 CMI gave selling signal but Bollinger Band showed less volatility that time which indicates that price might increase in future. In this date 33% investor sold their stock and price is found to increase, so they incurred loss.
Beximco Pharma: The Beta of Beximco Pharma is 1.37034. It is greater than 1 and it indicates that the stock of Beximco Pharma is high volatile.
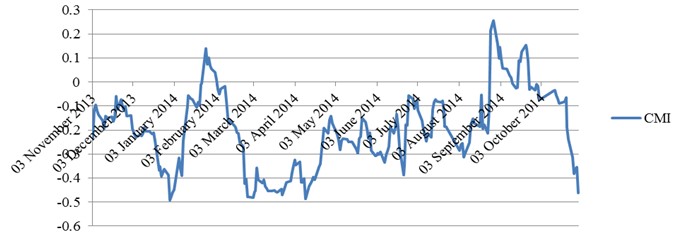
Purchase and Sale by Respondents: In September 17, 2014 CMI showed weak selling signal. From few days earlier of that date in Bollinger Bands, closing price started to grow up keeping in touch with upper band. So theoretically it should fall afterwards and exactly that happened then. 30% investors invested that time so they incurred loss. In December 30, 2013 CMI gave strong selling signal but Bollinger Band showed purchase signal. 28% investor sold that time but the price get rise. Here, Bollinger Bands were found more efficient.
CONCLUSION
Data mining tools should be given priority over traditional judgements while making investment decision in stock market.In thestudy three data mining tools namely Beta Analysis, Chaikin’s Money Flow Indicator and Bollinger Bands are used to assess whether the decision making were appropriate. Other than some exceptions at several times throughout the year, data mining tools are found very much effective to predict the condition of future stock market. The exceptions that the market followed opposite to the predictions from data mining tools may be due to volatility, as the stock market of Bangladesh is very much volatile. The study found Bollinger Band is more efficient than Chaikin Money Flow Indicator.The study also revealsthat, for more precise decision making Beta Analysis should work out with Bollinger Bands.The study finding should not be generalized as the study is based on the data collected from the investors of Khulna city. A broad-based future study taking data across several stocks and more investors from different cities would contribute to the generalization of the findings at the national level. Finally, a more sophisticated statistical technique such as neural network or other data mining techniques can be used to further enrich the research findings. The findings of the study are expected to aid the general investors and practitioners in the financial markets in selecting appropriate tools for making investment decisions. It also suggests that awareness needs to be built about the benefit of using data mining tools among the investors who often found to make wrong decisions and incur losses.
References
- Blume L, Easley D & O’Hara M. (1994), “Market Statistics and Technical Analysis: The role of volume.” Journal of Finance, Vol. 49 No 1, pp.153-181.
- Bollinger, J. (1992). “Using Bollinger Bands”. Stocks & Commodities Vol.10 No. 2, pp. 47-51
- Bollinger, J. (2001). Bollinger on Bollinger Bands, McGraw-Hill, New York.
- Granville, J. E (1976). New Strategy of Daily Stock Market Timing for maximum profit. Simon & Schuster, New York.
- Hossain, S. (2013), “The Impulsive stock Market of Bangladesh and the Great Recession.”, International Journal of Business and Social Research, Vol. 3 No. 3 pp 126-135
- Hurst, J. M. (1970). The Profit Magic of Stock Transaction Timing. Prentice Hall Inc., Englewood Cliffs, N.J.
- Kabasinskas, A. and Macys, U. (2010) “Calibration of Bollinger Bands Parameters for Trading Strategy Development in Baltic Stock market”, Inzinerine Ekonomika-Engineering Economics, Vol. 21 No. 3, pp. 244-254.
- Kamath, S. (2012), “Stock Market Analysis” Master’s thesis. The Faculty of the Department of Computer Science, San José State University.
- Kannan, K. S., Sekar, P. S., Sathik, M. M., and Arumugam, P. (2010). “Financial stock market forecast using data mining techniques”. In Proceedings of the International Multiconference of Engineers and Computer Scientists Vol. 1, March 17-19, 2010, Honkong.
- Khalid, M., Sultana, M., and Zaidi, F. (2013). “Dual Beta Modeling of Karachi Stock Exchange.”, Mathematical Theory and Modeling, Vol. 3 No. 8, pp. 26-34.
- Lento, C., and Gradojevic, N. (2007). “The Profitability of Technical Trading Rules: A Combined Signal Approach.” Journal of Applied Business Research. Vol. 1 No. 23, pp. 13-28.
- Mahajan, K. S. and Kulkarni, R. V. (2013), “A Review: Application of Data Mining
Tools for Stock Market.”, Int. J. Computer Technology & Applications, Vol 4 No. 1, pp19-27. - Mandelbrot, B. B. (1963). “The variation of certain speculative prices.” Journal of Business, No. 36, pp. 394-419.
- Mandelbrot, B. B. (1963). “New methods in statistical economics.” Journal of Political Economy No.71, pp. 421-440.
- Markowitz, H. M. (1959). Efficient Diversification of Investments. John-willey and Sons.
- Mehra, R. and Srivastava, N. (2014), “The Need and Importance of a volume based index. ACRN”, Journal of Finance and Risk Perspectives. Vol. 3 No. 3, pp. 103 – 122.
- Ou, P. and Wang, H. (2009), “Prediction of Stock Market Index Movement by Ten Data
Mining Techniques.” Modern Applied Science. Vol 3 No.12 pp.28-42 - Wahlstrom, C., (2008). “Beta: A Statistical Analysis of a Stock’s Volatility”. Downloaded from https://orion.math.iastate.edu/dept/thesisarchive/MSM/WahlstromMSMF08.
Pdf on 06/12/2014. - Wikepedia (2014), “Beta fianance” http://en. wikipedia.org /wiki/ Beta_ %28finance % 29#cite_note-8 accessed on 06/12/2014
© The Author 2016. Published by Business Review – A Journal of Business Administration Discipline, Khulna University, Khulna, Bangladesh.

Keywords